
$700,000+ Revenue in One Year with Klaviyo Email Marketing
In 12 months with 10 automations built in the first three months, we achieved $700,361 in attributable email revenue – 59% from flows, 41% from campaigns.
Key Results
| $700,361Total Revenue (1 Year) | $413,838From Flows — 59% | $286,523From Campaigns — 41% | 10Automations (First 3 Months) |
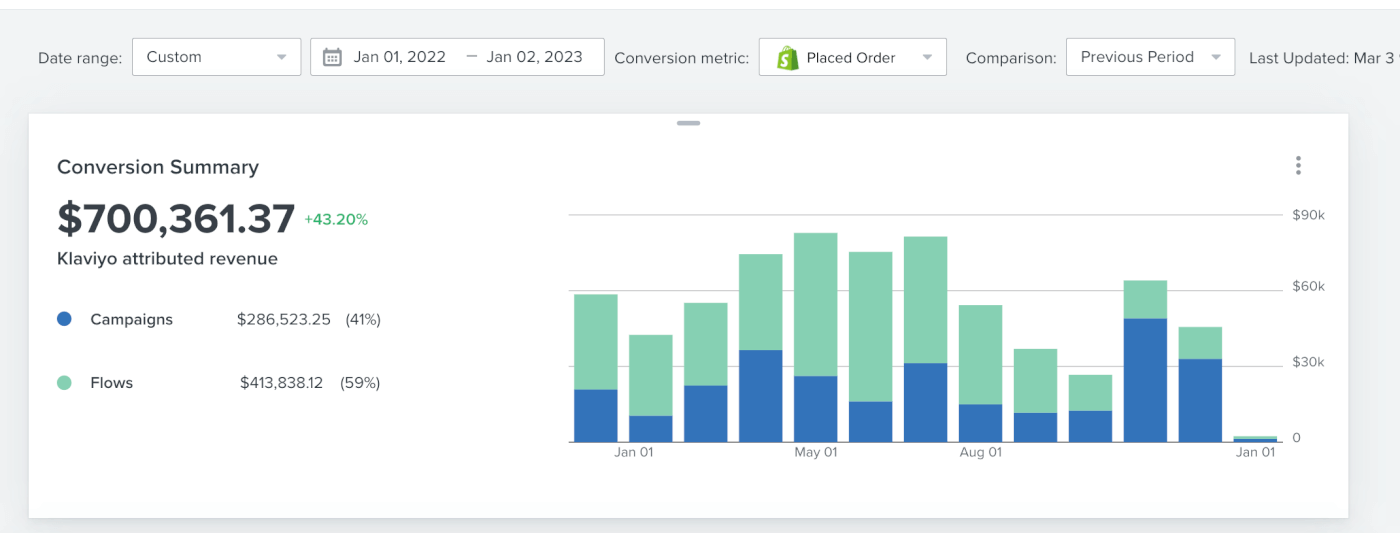
Klaviyo Dashboard: Annual Revenue Overview
The screenshot below is the full-year Klaviyo summary for this client. Flows doing the heavy lifting at 59%, campaigns supporting consistently throughout the year.
Klaviyo annual revenue, $700,361 total, flows 59%, campaigns 41%
Revenue Breakdown — Flows vs Campaigns
Flow revenue attribution: $413,838 across automated sequences

Campaign revenue: $286,523 from 12 months of consistent sends
Flow Architecture
In the first 3 months into the project, we built 10 automations, covering every stage of the customer lifecycle from welcome through to win-back. Once built, they ran 24/7 without any manual effort.

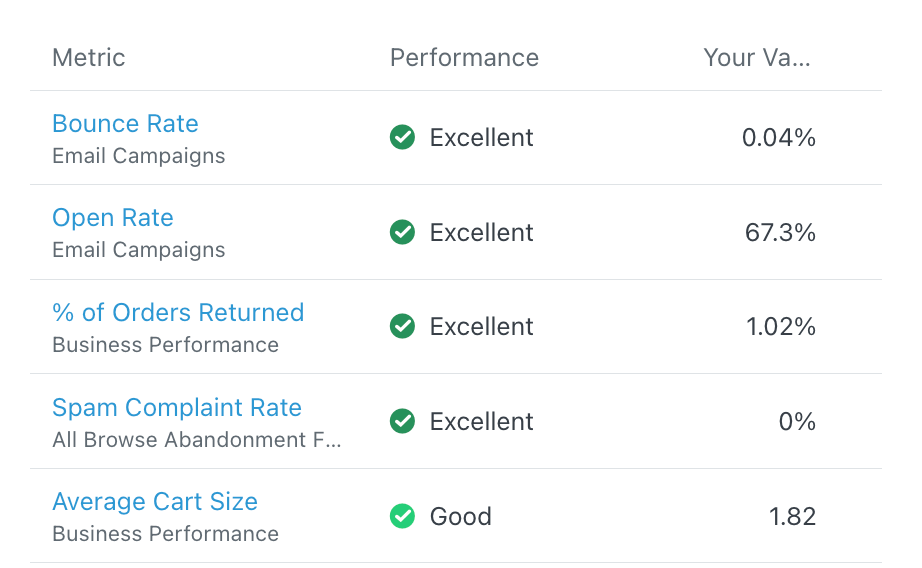
Reporting & Analytics Dashboard
Every decision was backed by data from Klaviyo, Google Analytics, Shopify, and custom dashboards. Weekly and monthly reports kept the client aligned at every stage.

Reporting dashboard used for regular client performance updates
Full Strategy Breakdown
- Opt-ins & List Building: Lead magnets, landing pages, and on-site capture forms to grow a clean, engaged list before anything else went live.
- Segmentation: List split by behaviour, purchase history, and interests so every send reached the right person at the right time.
- Email Design: Mobile-first templates, brand-consistent, built to drive clicks, not just opens.
- Content Creation: Storytelling, education, promotions, and time-limited offer. A full content mix that keeps subscribers engaged month after month.
- 10 Automations: All configured within the first 3 months and running 24/7 across the entire customer lifecycle from day one.
- A/B Testing & Analytics: Continuous subject line, copy, and CTA testing, tracked via Klaviyo, Google Analytics, Shopify, and custom dashboards.
The Takeaway: Flows generated 59% of revenue without a single manual send. That’s what building the automation infrastructure right from the start actually looks like. Campaigns added the other 41%, keeping the brand front of mind all year without the list going cold.
Results Summary
| Metric | Result |
|---|---|
| Total Klaviyo Revenue (12 months) | $700,361 |
| Revenue from Automated Flows | $413,838 (59%) |
| Revenue from Campaigns | $286,523 (41%) |
| Automations Built | 10 (within first 3 months) |
| Reporting Cadence | Weekly & Monthly |
| Platforms Tracked | Klaviyo, Shopify, Google Analytics |